Lessons from Viz-a-thon
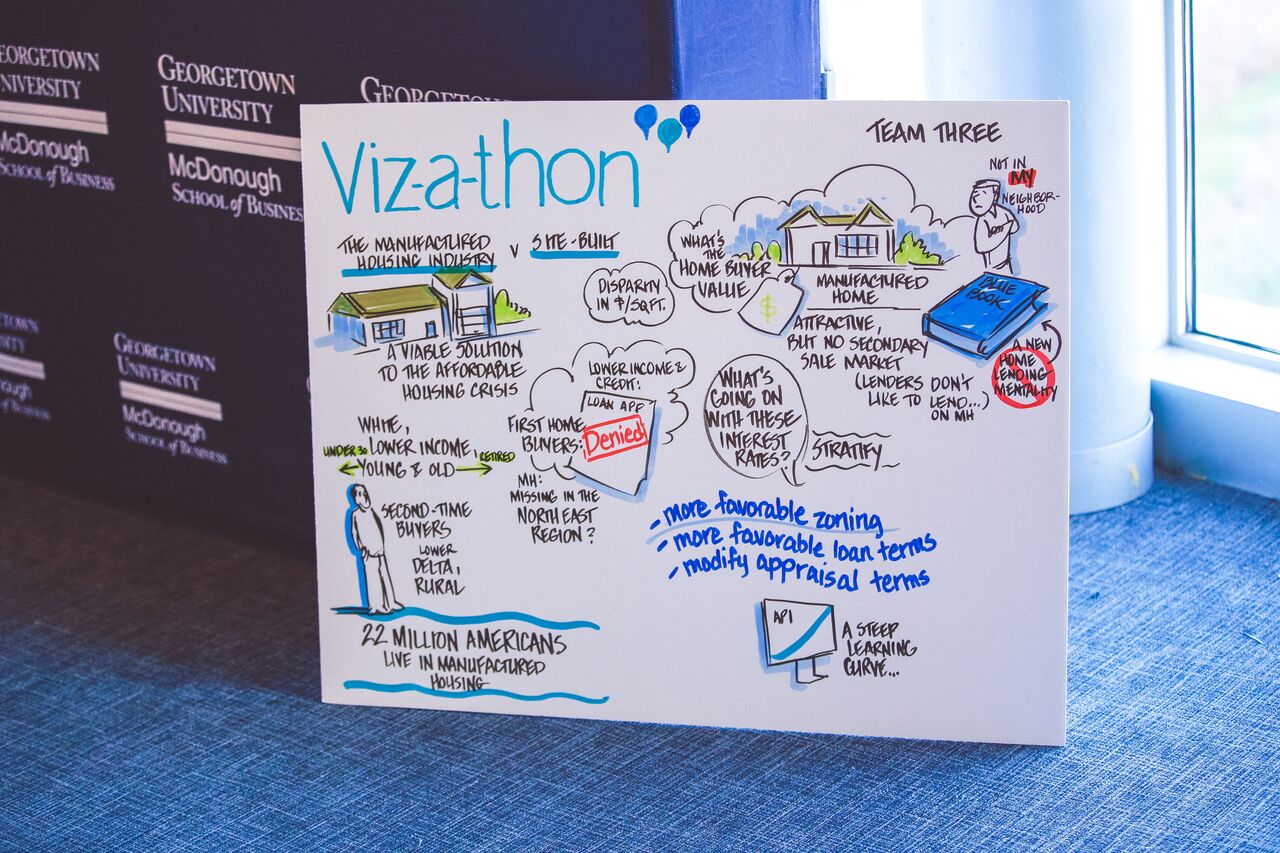
When you’re given gigabytes of unstructured data and asked to solve a problem, what would you do? How would you visualize the data, draw digestible insights, and come up with actionable solutions? This type of data visualization challenge was recently given to 5 MBA teams last weekend at Viz-a-thon, a data analysis case competition sponsored by Fannie Mae and the Georgetown University McDonough School of Business. I was honored to serve as one of the judges to evaluate their designs, insights, presentations, and technical solutions.

Each team was presented with 5 different datasets: a national housing survey, mortgage lender sentiments, manufactured housing data, housing indicators, and economic indicators. What these datasets have in common is the potential for understanding and addressing this country’s rising housing crisis. In the last 8 years, home prices have outpaced household income, and millions of families are having trouble finding affordable land and property. The housing problem has several causes, the most pronounced being an unbalanced supply and demand dynamic. Supply is constrained as a result of increased building material and labor cost; hyper demand is driven by a relatively healthy economy since 2008 and consumers’ desire for homeownership. Working in the open-economy marketplace in which supply and demand have always been on my mind, I can certainly relate to and appreciate the challenge of this social problem, and I was pleased to see thoughtful ideas presented by each MBA team.
Datasets aside, visual design was the most heavily weighted judging criterium. While it’s refreshing to see presentations on economic trends mapped across the country, I can tell data visualization is not something commonly taught at school and wish to share some of my personal takeaways.
- Understand the purpose of the presentation and visualization: charts have different purposes. For example, line charts are meant to show progress and changes over time with x-axis commonly used for date and time. On a macro-level, charts and graphs enrich PowerPoint slides, not just aesthetically. They synthesize data and draw out key insights. While some people use visualization as decoration (i.e., pretty infographics), I believe every chart and graph has to have purpose as a visual guide or a complement to the presentation narrative.
- Strive for solutions even though not all data are available: given each team had relatively similar datasets, it became clear that the winning team had to shine in their solutions because most of the team shared relatively similar insights and charts (I think I saw a “Tableau US Map” in 3 out of 5 presentations). Most business school students can relate to reading Harvard Business School case studies and wondering what happened to the companies in the end – did the company find a solution to cut costs? Motivate employees? Avoid race-to-the-bottom price competitions? People, especially those who are in business, are drawn to solutions. While no solution is bullet-proof, being able to demonstrate problem-solving skills is key to getting internships or full-time positions in the modern business world. And don’t mistake recommendations with solutions. Recommendations are like sketches. While they’re nice to have to get started, or develop a vision, they won’t help to actually build the house. Solutions are more like blueprints, specifying materials and dimensions.
- Hone in on simplicity: unless the PowerPoint slide is meant for comparing two different concepts illustrated in easy-to-digest charts or showing patterns, I recommend limiting the number of charts to one per slide. For each chart, the viewer is thinking about (or trying to think about) what is being shown, what is being said, and the agreement between the two. Showing too many charts dilutes the purpose of the slides and prevent the audience from getting insights out of the presentation because they are too complex or just overwhelming. Simplicity is key for communication.
There are many resources for data visualization, but a few of my favorites are:
- Guide to Information Graphics, Dona Wong
- The Visual Display of Quantitative Information, Edward Tufte (insert Amazon link)
- Universal Principles of Design, William Lindwell, Kritina Holden, Jill Butler
Thanks to Fannie Mae‘s incredible team (especially Stacy) for putting together this case competition to encourage students to think about solutions to social issues and enhance their visual story-telling skills. Looking forward to next year’s Viz-a-thon!